
This is an old revision of the document!
Netscaler NS12.0 (Build 57.153.nc) in NSMPX-15000-50G
Port configuration (front and back panel): External Link. : 4x40GE QSFP+ and 8x10GE SFP+ ports.
- Cluster commands:
- sh cluster instance 1
- sh cluster node 0-1
- MY NOTES on ns10 : External Link
- MPX,SDX,VPX: External Link
jargon:
- LON
- MPX: Purely bare metal, 14040-S
- SDX: hardware hosting xen server
- VPX: virtual ns. Hosted in
- MAS vs Cluster coordinator
- NSIP: to administer the box
- SNIP: towards the backend servers. Type 'Subnet IP'
- USNIP enabled. That's what tells it to use the SNIP as the source IP.
- USIP Fo your web servers need to see the real client IP. You'd also need to change the web server's default gateway to the SNIP.
Interface status:
show interface -summary
show interface stats
sh interface -summary          # to quickly see mac addressses.
show channel # for lacp
show vlan # to see vlans and interfaces assigned to them

cli command to check power supply. rem that linux command suite for hardware status..
Installation
Uplink SFP+ (optic transceivers) Backend SFP+ (optic transceivers)
NETSCALER TROUBLESHOOTING:
- Check ns0 and ns1 config is stored in rancid
- Check console works
- save ns config
- Logs in GUI:
- recent: system > Auditing > Syslog
- System>Diagnostics>Maintenance>Delete/Download log files
backups.dc.grapeshot.co.uk messageshosts]# xzgrep AdminFrontend_Cluster netscaler02-mgt.dc.grapeshot.co.uk.log-20191023.xz | grep DOWN
Check this link: http://dknetscaler.blogspot.com/
sh ns connectiontable
stat serviceGroup Asci_Cluster | more
stat lb vserver Asci_Cluster_SSL
disable interface <interface_num>  # to disable an interfaces (enable for the opposite)
NINJA TOOLS HERE, LOG SEARCH FEAT.: https://www.slideshare.net/davidmcg/indepth-troubleshooting-on-netscaler-using-command-line-tools
LOG ANALYSIS
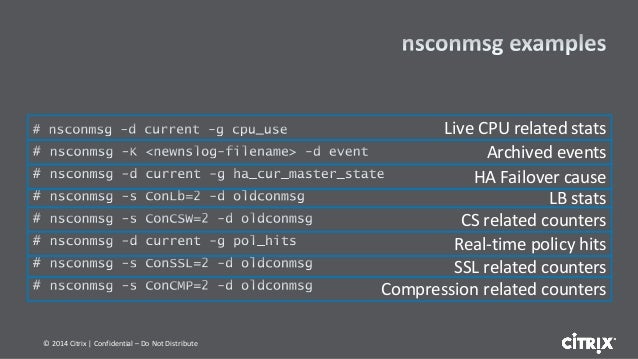
nsconmsg cheat sheet
nsconmsg -K newnslog.99 -d event -d current | grep high_cpu
nsconmsg -K /var/nslog/newnslog.73.tar.gz
Reads /var/nslog/newnslog formatted log files and displays the data
"-d <operation> - display performance data"
- setime start and end time of data file
- stats Display current statistic counters
- statswt0 Display non-zero statistic counters
- current Display current performance data
- event Display event details
- consmsg Display console message
same command to view archived logs. For instance if you have a newnslog.100 file.
cd /var/nslog
tar xvfz newnslog.100.tar.gz
/netscaler/nsconmsg -K /var/nslog/newnslog
monitor
We can also use nsconmsg for real time statistics:
nsconmsg -d current -g cpu_use
nsconmsg -d current -g ha_cur_master_state
Create and upload tech support bundle files from the netscalers
GENERATE
show techsupport # for individual node tech support
show techsupport -scope CLUSTER # from the cluster vip , for cluster related tech supprt
UPLOAD (from the device itself). This is just an example. Citrix credentials are required
/var/tmp/support perl cis_upload.pl [-sr <service request number>] [-description <description>] <collector file or trace file or any other file>
On the Netscaler load balancer, to generate a tech support bundle you can use:
show techsupport -scope CLUSTER
If you already have a case open, then you can upload it directly to the case using
show techsupport -scope cluSTER -casenumber ### -upload -userName colinkeith -password XXX
If you have generated an existing file you can add the filename with the additional option:
file /var/tmp/support/support.tgz
NETSCALER CRASHING
If the device crashed, we should have recent information (dump file)
/var/core
UPGRADE NETSCALER:
Cluster mode
- Check console access to both nodes
- Double check current configuration is stored in rancid
- Check synchronization is OK
- Save configurations
- Access each node through its NetScaler IP (NSIP)
show cluster node
show cluster instance
force cluster sync   # This only IF Required
cd /var/nsinstall
mkdir x_xnsinstall
cd x_xnsinstall
tar -zxvf ns-x.0-xx.x-doc.tgz
./installns

* After the uprade, restart the node.
* Check all is OK (passing traffic) and move to the next (configuration) one
Ref: https://docs.citrix.com/en-us/netscaler/10-5/ns-system-wrapper-10-con/ns-cluster-home-con/ns-cluster-sw-updowngrade-tsk.html
HA mode:
For HA: https://support.citrix.com/article/CTX127455
SECURITY::
Layer 7 DDoS features - https://support.citrix.com/article/CTX131681#4
SYN COOKIES: https://docs.citrix.com/en-us/netscaler/11/security/ns-httpdosp-wrapper-con-10/ns-syn-dos-protection-con.html?_ga=2.64581611.554544567.1523534518-212221746.1522186237
….A NetScaler appliance defends against SYN flood attacks by using SYN cookies instead of maintaining half-open connections on the system memory stack….
So “here you have a cookie with my syn-ack while you send me the final ACK. I am not allocating any memory or wait for that ack”
AUTOMATION
Local crontab:
root@netscaler01-mgt# tail -2  /etc/crontab
*/5     *       *       *       *       root    /netscaler/nscli -U 127.0.0.1:nsroot:xei1reiD "enable interface 1/10/3;enable interface 1/10/4;enable interface 1/10/7;enable interface 1/10/8;enable interface 1/LA/2;enable interface"
Types of SSL proxying: SSL_BRIDGE SSL TCP
Routing in the netscaler (ZebOS) http://docs.citrix.com/content/dam/docs/en-us/netscaler/10-1/downloads/Citrix-ZebOSBGPCmdRef.pdf
stat lb vserver oe-4010-secondary-StateStreet -fullValues  <-- vservers sumary
stat service <-- services summary
stat lb vserver oe-4006-primary-Barcap
show ns connectiontable | grep EST | grep TCP | grep 94.142.190.6 | grep 4007  <-- To see who is connected to each port
CONFIGURATION
show interface stats # << <hidden> shows interface status in terse mode
Typical server, service and vserver definition (see attachment):
- Bind service with server (add service)
- Define vserver (add lb vserver)
- Bind vserver with service
vserver
Slow start algorithm makes the lb falls to round robin when a new server is added (see link Link).
» Configured Method: (load balancing method (see lbMethod ):
- ROUNDROBIN: Rotates the outgoing packets among the available links. This method distributes packets equally among the links, even if they operate at different speeds. Therefore, it can result in retransmissions or out-of-order packets.
- DESTINATIONHASH: Uses the hashed value of the destination IP address to select a link. You can mask the destination IP address to specify which part of it to use in the hash-value calculation, so that requests that are from different networks but destined for the same subnet are all directed to the same link.
- LEASTBANDWIDTH: Selects the link that is currently serving the least amount of traffic, measured in megabits per second (Mbps).
- LEASTPACKETS: Selects the link that has received the fewest packets in the last 14 seconds.
- LEASTCONNECTION ←- Be aware that the Current Method sometimes differs, reason https://discussions.citrix.com/topic/346871-lb-configured-method-vs-current-method/
Persistence (persistenceType)
- Persistence type for the virtual server. Possible values:
- SOURCEIP: Persistence based on the source IP address of inbound packets. After the load balancing method selects a link for transmission of the first packet, the NetScaler directs all subsequent packets sent from the same source IP address to the same link.
- DESTIP: Persistence based on the destination IP address of outbound packets. After the load balancing method selects a link for transmission of the first packet, the NetScaler directs all subsequent packets for the same destination IP address to the same link.
- SRCIPDESTIP: Persistence based on the source IP address of inbound packets and destination IP address of outbound packets. After the load balancing method selects a link for transmission of the first packet, the NetScaler directs all subsequent requests from the same source IP address and to the same destination IP address to the same link.
CLUSTER INITIAL SETUP:
1.- Configure LOM: In each of the boxes, under shell. Then reserve that IP in the meraki:
shell
ipmitool lan set 1 ipsrc dhcp
ipmitool lan print 1
2.- If we are managing the ns via public address, limit http access just to prod (in both csw)
4.- Configure management address in both ns
3.- Create the cluster: https://docs.citrix.com/en-us/netscaler/12/clustering/cluster-setup/cluster-create.html
BARE METAL INITIAL SETUP:
LICENSING NOTES:
sh ns license
BACKEND MONITOR OR HEALTHCHECKS:
This is a classical, added, monitor:
add lb monitor http-healthcheck HTTP -respCode 200 -httpRequest "GET /healthcheck" -LRTM ENABLED -interval 30 -resptimeout 20 -destIP 0.0.0.0 -devno 247431220
Then in the backend server:
dnf install httpd
change listening port in /etc/httpd/conf/httpd.conf
systemctl start httpd
touch /var/www/html/healthcheck # so the 'GET /healthcheck' succeeds
